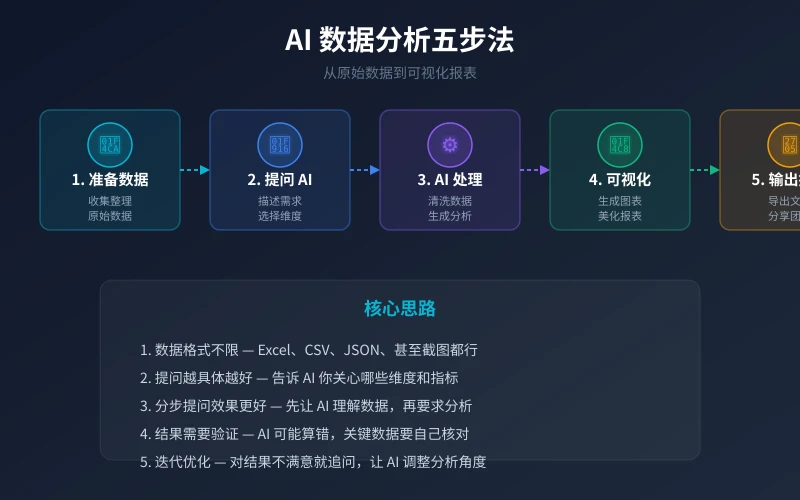
AI Data Analysis Guide: From Excel to Smart Reports

Why You Need AI for Data Analysis
Every month-end, do you find yourself staring at spreadsheets full of numbers, trying to squeeze out meaningful insights? Sales data, user behavior, financial reports — the data piles up, but useful information stays buried.
Traditional data analysis either means wrestling with Excel formulas (which gets painful fast) or hiring a data analyst (expensive and slow). But now, AI tools can handle most of the analysis for you. Just hand over your data, tell it what you want to know, and you'll get a well-structured report in minutes.
This guide walks you through AI-powered data analysis from scratch. No programming background, no statistics knowledge required — if you can type, you can do this.
What You Need to Get Started
- An AI chatbot: ChatGPT, Claude, DeepSeek, or Doubao all work
- Your data: Excel, CSV, or JSON work best; even screenshots are fine
- A clear goal: What do you want to find in the data? Trends? Problems? Opportunities?
- 5-10 minutes: AI processes data far faster than you'd expect
Step 1: Prepare Your Data
Many people get stuck here, thinking "my data is too messy to analyze." Don't worry — AI is much more flexible about data formats than you think.
What Formats Work?
- Excel spreadsheets: The most common format. Just copy and paste into the AI chat
- CSV files: The standard format for data analysis. AI handles these most smoothly
- JSON data: If your system exports JSON, use it directly
- Screenshots/photos: Take a photo of a table — AI can recognize and analyze it (image recognition)
What If Your Data Is Too Large?
If you have thousands of rows or more, pasting directly may exceed AI's processing limits. Solutions:
- Filter in Excel first: Keep only the columns and recent months you care about
- Process in batches: Split data into segments, analyze separately, then summarize
- Upload files: Claude and ChatGPT both support file uploads for large datasets
Step 2: Describe Your Analysis Needs to AI
This is the most critical step in the entire process. The clearer your description, the better the results.
Basic Question Formula
A good question = Data context + Analysis goal + Output format
Example:
- ❌ Bad prompt: "Analyze this table"
- ✅ Good prompt: "This is our June sales data with product name, revenue, customer region, and sales channel. Please analyze product performance and regional distribution, and give improvement suggestions. Present results in a table format."
Advanced Tip: Ask Step by Step
For complex analysis, don't throw everything at AI at once. Step-by-step works better:
- Step 1: Let AI understand your data structure ("What is this data? What fields are there?")
- Step 2: Basic statistics ("Calculate total and average revenue per product")
- Step 3: Deep analysis ("What do top-selling products have in common?")
- Step 4: Get recommendations ("Based on these findings, what specific improvements would you suggest?")
Step 3: Generate Visual Charts
Numbers are informative, but charts are intuitive. AI can generate various visualizations:
Common Chart Types
- Bar chart: Compare categories (e.g., revenue by product)
- Line chart: Show trends (e.g., monthly sales trend)
- Pie chart: Show distribution (e.g., sales by region)
- Scatter plot: Find relationships (e.g., ad spend vs. revenue)
Chart Generation Prompts
- "Create a bar chart comparing revenue across products"
- "Generate a line chart showing the sales trend over the past 6 months"
- "Make a pie chart showing regional sales distribution"
AI typically generates Python code (using matplotlib or plotly). If you don't code, simply ask AI to share the chart result as an image, or describe the key insights in text.
Step 4: Verify and Refine Results
AI isn't perfect — the analysis results need verification.
What to Watch Out For
- Calculation accuracy: Ask AI to re-calculate key metrics and cross-check with your Excel
- Reasonableness of conclusions: Judge AI's suggestions against your actual business context
- Data currency: AI can't always access real-time data; stale data affects analysis
Not Satisfied? Just Say So
Tell AI exactly what you want changed:
- "This analysis angle isn't right — I want to look at it from a cost control perspective"
- "Results are too generic — please analyze declining products individually"
- "Can you add a month-over-month comparison?"
Real-World Example: Analyzing Sales Data
Suppose you're an operations manager at an e-commerce company, and your boss wants a sales analysis. Here's the complete workflow:
Step 1: Prepare Data
Export an Excel file from your backend with: date, product name, revenue, order count, customer region, sales channel.
Step 2: Paste to AI
Open ChatGPT or Claude, paste the table, and enter:
- "This is our June e-commerce sales data. Please: 1) Rank products by revenue 2) Analyze regional distribution 3) Find products with the largest month-over-month changes 4) Give specific suggestions to boost next month's sales. Answer in English, key data in tables."
Step 3: Review Analysis
AI returns a complete analysis report, typically including:
- Product revenue ranking table
- Regional sales distribution
- Month-over-month change data
- 3-5 specific improvement suggestions
Step 4: Create Charts for Your Boss
Ask AI to generate a few key charts, screenshot them, and add to a PPT or email. A professional sales analysis report is done.
Frequently Asked Questions
How Accurate Is AI Data Analysis?
AI is usually accurate for simple statistics (sums, averages, rankings), but complex calculations may occasionally have errors. Always verify critical numbers with your own Excel.
Is My Data Safe?
If your data contains sensitive information (personal data, trade secrets), use enterprise AI tools, or anonymize sensitive fields first (e.g., replace real names with codes).
What Scenarios Work Best?
- Weekly/monthly reports: Quickly organize data, generate charts, write summaries
- Market research: Analyze competitor data, user feedback, industry trends
- Anomaly detection: Find outliers and potential issues in data
- Option comparison: Use data to compare pros and cons of different approaches
I Don't Know Programming — Can I Still Use This?
Absolutely. Everything in this guide requires zero programming. If you can copy-paste and describe what you need, AI handles the rest.
Related Articles
AI 本地部署入门:零基础三步跑起大模型,完全免费
不用注册、不用充钱、完全离线。本文手把手教你用 Ollama 等工具,在自家电脑上部署运行开源大模型,从零开始完成本地 AI 部署的全过程。
TutorialsAI 帮你做购物决策:从比价到避坑的完整实操指南
买手机、买耳机、买电脑,AI 真的能帮你选对吗?本文用五个实操步骤,手把手教你让 AI 完成价格对比、参数解析、口碑筛选和避坑提醒,小白也能 10 分钟搞定购物决策。
TutorialsAI 语音输入与语音转文字:零基础 5 分钟上手,解放双手的写作新方式
打字太慢?说话比打字快 3 倍。这篇文章手把手教你用 AI 语音输入工具,从选择工具、开始录音到转文字、编辑导出,五大步骤、六大场景,让你从此"说话即写作"。
Comments are not yet available, stay tuned