AI Data Analysis for Beginners: Create Tables, Charts, and Reports with AI (No Experience Needed)
Why Use AI for Data Analysis?
Many people get intimidated at the mere mention of "data analysis" – you'd have to learn Excel formulas, Python code, SQL queries... just getting started takes months. But now, AI can handle 90% of your data analysis work without you writing a single line of code.
You only need to "feed" your data to AI, then tell it in plain language what you want to analyze, and it will generate charts, calculate metrics, and write reports. Sounds like science fiction? In fact, many people are already doing it this way.
This article teaches you, in the simplest terms, how to start using AI for data analysis from scratch.
What Do You Need to Prepare?
Before you begin, you need two things:
- A data set: an Excel spreadsheet, a CSV file, or even a table copied from a webpage will work
- An AI tool: ChatGPT (recommended because it has a code interpreter), DeepSeek, or Claude are all fine
No data? No problem – later I'll show you how to ask AI to generate sample data for practice.
Overview of the Four-Step Process
The entire data analysis process can be broken down into four steps, and AI can help you with each one:
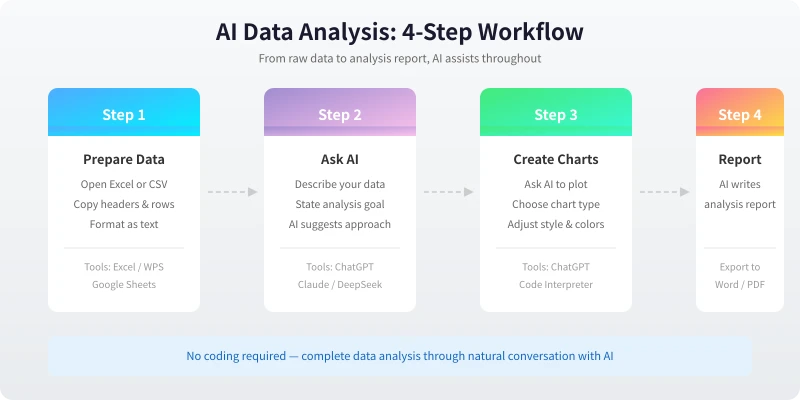
Below I explain each step in detail.
Step 1: Prepare the Data
The first step in data analysis is to organize the data. This step doesn't require AI, but it is important.
If You Have an Excel or CSV File
The simplest way is to open the file, select the data area, and directly copy and paste it into the AI chat window. Note the following:
- Keep the header: The column names in the first row are important – AI needs to know what each column represents
- Moderate data size: If there's too much data (more than 100 rows), you can first copy the first 20 rows to let AI understand the structure, then analyze incrementally
- Check formatting: Make sure numeric columns don't contain text, and date formats are consistent
If You Don't Have Existing Data
You can ask AI to generate sample data. Try asking like this:
"Please generate a sample e-commerce sales dataset with columns: date, product name, sales quantity, unit price, and region. Include 50 rows and display it in a table format."
AI will immediately create a well-structured sample dataset that you can use for practice.
Data Description Template
When sending data to AI, it's recommended to include a brief description. Use this template as a reference:
"Here is my sales data table. Column descriptions: Column A is the date, Column B is the product name, Column C is the sales quantity, Column D is the unit price, and Column E is the region. Please first help me understand the basic situation of this data."
With this description, AI can accurately interpret your data structure, making subsequent analysis more precise.
Step 2: Let AI Analyze the Data
Once the data is ready, you can start the analysis. The key is – you don't need to know which specific methods to use; you just need to tell AI what you want to know.
Common Analysis Requests
Below are several practical example prompts you can copy and use directly:
Basic Statistics
"Please perform the following analysis:
1. Basic statistics for each column (mean, max, min)
2. Which product has the highest sales?
3. What is the sales share by region?"
Trend Analysis
"Please aggregate sales by month, analyze the sales trend, and identify which months are peak seasons."
Comparative Analysis
"Please compare sales performance across different regions, identify the best and worst performing regions, and analyze possible reasons."
Anomaly Detection
"Please check the data for anomalies, such as sudden spikes or drops in sales, and explain the reasons."
Ask AI to Process with Code
If you're using ChatGPT (with the Code Interpreter feature), you can directly ask it to process the data with Python:
"Please use Python to read this data, calculate monthly sales and month-over-month growth rates, and identify the category with the fastest growth."
ChatGPT will automatically write Python code, execute it, and display the results. You don't need to understand code – just look at the results.
Step 3: Generate Visual Charts
One of the most valuable parts of data analysis is visualization – turning numbers into charts so patterns can be seen at a glance.
Directly Ask AI to Draw
The simplest way is to describe what chart you want:
"Please use this data to draw a bar chart showing sales comparison across regions."
"Please draw a line chart showing the sales trend over the past 12 months."
"Please draw a pie chart showing the sales share of each category."
Common Chart Types and Use Cases
- Bar chart: Compare values across categories (e.g., sales by region)
- Line chart: Show trends over time (e.g., monthly sales)
- Pie chart: Show parts of a whole (e.g., category share)
- Scatter plot: Analyze the relationship between two variables (e.g., price vs. sales)
- Heatmap: Display distribution across multiple dimensions (e.g., sales activity by time slot)
Advanced: Make Charts Look Better
Charts generated by AI by default may be simple. You can ask it to beautify them like this:
"Please restyle the above chart in a business style, using dark blue and gray colors, and add data labels and a title."
ChatGPT's Code Interpreter can generate high-resolution images that you can download and use in reports or PPTs.
Step 4: Generate an Analysis Report
After the analysis is done and charts are ready, the final step is to compile everything into a complete report.
Ask AI to Write the Report
Simply tell AI:
"Please write a data analysis report based on the above analysis. Include: data overview, key findings, trend analysis, and recommendations. Output in Markdown format."
AI will generate a well-structured report in seconds, including data references, chart explanations, and action suggestions.
Report Optimization Tips
- Specify the audience: Tell AI who the report is for (boss, client, team) – it will adjust the tone and depth accordingly
- Request an executive summary: Add an "executive summary" at the beginning so busy readers can quickly grasp conclusions
- Include recommendations: Ask AI to provide concrete, actionable suggestions at the end, not just data
- Export format: Markdown reports can be pasted directly into Word or Notion
Report Template
If you're not sure what to include in the report, use this template:
"Please write a data analysis report with the following sections:
1. Executive summary (within 200 words)
2. Data overview (data source, time range, sample size)
3. Key findings (3-5 points)
4. Detailed analysis (with chart explanations)
5. Conclusions and recommendations
Write in a professional business style."
Tool Selection: Which AI Is Best for Data Analysis?
Different AI tools have their own strengths. Here's a quick guide to help you choose:
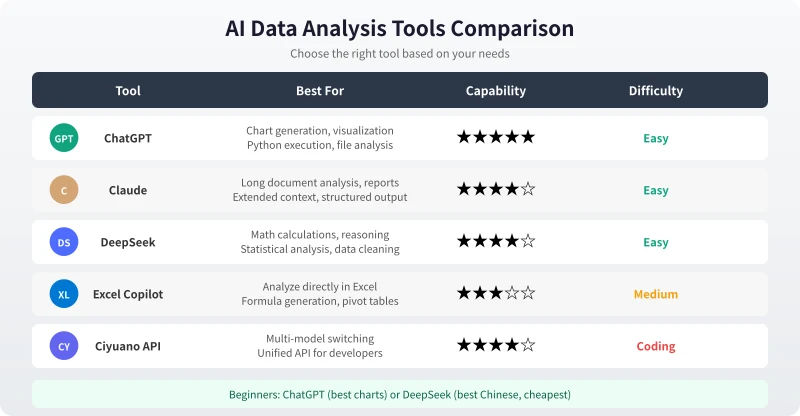
ChatGPT (First Choice)
ChatGPT is currently the most comprehensive tool for data analysis. It comes with a built-in Code Interpreter that can directly read Excel and CSV files, and use Python for data processing and visualization. After uploading files, you just describe your needs in natural language.
Best for: Charting, complex data processing, report generation
DeepSeek (Best Value)
DeepSeek performs well on Chinese data processing and is very affordable. Although it doesn't have a built-in code execution environment, it is strong at understanding data and providing analysis suggestions.
Best for: Chinese data analysis, tight budgets, high-volume conversations
Claude (Long Document Analysis)
Claude supports extremely long contexts, making it ideal for analyzing large amounts of text data. If your "data" is long reports, survey documents, meeting minutes, or other text content, Claude is the best choice.
Best for: Text analysis, long document processing, report writing
Real-World Example: Analyzing Sales Data with AI
Below is a complete example demonstrating the entire process from data to report.
Scenario
You have six months of sales data from an e-commerce platform. You want to know: which category sells best? Which region is growing fastest? How should you stock inventory for next month?
Steps
Step 1: Upload the Data
Open ChatGPT, click the "Attach" button on the left side of the chat window, and upload your Excel file.
Step 2: Initial Understanding
Type:
"First, help me understand the basic situation of this data: how many rows and columns are there? What data types are in each column? Are there any missing values?"
AI will quickly scan the data and provide an overview.
Step 3: In-Depth Analysis
Type:
"Please perform the following analysis:
1. Aggregate sales by category and show the TOP 5
2. Calculate average monthly sales and growth rates by region
3. Analyze the relationship between sales volume and price"
Step 4: Generate Charts
Type:
"Please generate three charts:
1. A bar chart of sales by category
2. A line chart of monthly sales trends by region
3. A scatter plot of price vs. sales volume"
Step 5: Write the Report
Type:
"Please write a report based on the above analysis, focusing on: which categories should be prioritized for next month's inventory? Which regions need more marketing efforts?"
The whole process takes about 10-15 minutes, and you'll have a professional data analysis report. Using traditional methods (manual analysis in Excel), it might take half a day.
Frequently Asked Questions
Is my data secure?
Major AI platforms (ChatGPT, Claude, DeepSeek) all have privacy protection policies. Generally, the data you upload is not used for model training. However, if your data contains business secrets or personal privacy, it's recommended to:
- Remove sensitive columns before uploading (e.g., names, phone numbers, ID numbers)
- Use sample data instead of real data for initial analysis
- Choose enterprise or on-premises deployment solutions
Are the AI analysis results accurate?
AI analysis results are usually reliable, but they cannot completely replace human judgment. It's recommended to:
- Cross-verify key data points
- Ask AI to explain its analysis logic and check if it makes sense
- Combine business experience when making final decisions
What if the data is too large?
If the data exceeds several thousand rows, it's recommended to:
- First do preliminary filtering and aggregation in Excel, then send to AI
- Upload in batches and let AI analyze different dimensions
- Use ChatGPT's Code Interpreter, which can handle large files directly
What if I don't know how to phrase analysis requests?
You can simply tell AI about your business background and confusion, and let it help you determine the analysis direction:
"I'm an operations manager at an e-commerce company. I have six months of sales data but don't know which angles to analyze. Please help me create an analysis plan."
AI will recommend suitable analysis dimensions and methods based on your scenario.
Advanced Tips
After mastering the basics, try these advanced techniques:
Automate the Analysis Workflow
If you need to regularly analyze the same type of data (e.g., weekly sales reports), ask AI to create a standard analysis template. Then each time you only need to replace the data.
Integrate Multiple Data Sources
If you have multiple tables that need to be analyzed together (e.g., sales data + inventory data + user data), send them all to AI and ask for cross-analysis.
Use the TokenCircle API to Access Multiple Models
On the TokenCircle platform, you can access multiple models like ChatGPT, DeepSeek, and Claude with a single API Key:
- Visit the model list to see all available models
- Create an API key on the API Key management page
- Set the API endpoint to
https://www.ciyuano.com/v1and fill in your key
This way, you can flexibly switch between the most suitable model for different analysis needs.
Summary
The core of AI data analysis is four steps: Prepare the data → Ask questions → Generate charts → Write the report. No need to learn Python, no need to memorize Excel formulas – you only need to know how to converse with AI in natural language.
For beginners, I recommend starting with ChatGPT. Upload your own data and follow the steps in this article. When you see that AI can complete in minutes what used to take you hours, you'll truly understand the value of AI.
Related Articles
AI 本地部署入门:零基础三步跑起大模型,完全免费
不用注册、不用充钱、完全离线。本文手把手教你用 Ollama 等工具,在自家电脑上部署运行开源大模型,从零开始完成本地 AI 部署的全过程。
TutorialsAI 帮你做购物决策:从比价到避坑的完整实操指南
买手机、买耳机、买电脑,AI 真的能帮你选对吗?本文用五个实操步骤,手把手教你让 AI 完成价格对比、参数解析、口碑筛选和避坑提醒,小白也能 10 分钟搞定购物决策。
TutorialsAI 语音输入与语音转文字:零基础 5 分钟上手,解放双手的写作新方式
打字太慢?说话比打字快 3 倍。这篇文章手把手教你用 AI 语音输入工具,从选择工具、开始录音到转文字、编辑导出,五大步骤、六大场景,让你从此"说话即写作"。
Comments are not yet available, stay tuned