AI Data Analysis & Visualization: Understand Your Data Without Writing Code

Every month-end, your boss asks you to prepare a sales data analysis report. You open Excel, stare at the dense numbers, and have no idea where to begin — sums, averages, trend lines, year-over-year, month-over-month... these concepts sound intimidating. Don't panic — AI can handle all of this for you, and you don't need to know any formulas or programming.
Why Can AI Help You with Data Analysis?
Data analysis sounds sophisticated, but it's essentially three things: spotting trends, finding anomalies, and making comparisons. AI excels at all three — it can quickly scan hundreds or thousands of rows of data, identify patterns invisible to the naked eye, and present them visually through charts.
Benefits of using AI for data analysis:
- Zero barrier: No need to learn Excel formulas, Python, or any professional tools
- Fast: Thousands of rows of data analyzed in seconds
- Thorough: AI catches anomalies and hidden trends that manual analysis might miss
- Explainable: AI doesn't just give results — it tells you "why" and "what to do"

Step 1: Prepare Your Data
Before sending data to AI, you need to format it in a way it can understand. The simplest method is to copy and paste table content directly.
Supported Data Formats
- Excel spreadsheets: Select the data area, Ctrl+C to copy, paste directly into the AI chat
- CSV files: Open with Notepad, select all, copy
- Web tables: Select the table area directly from a webpage and copy
- Plain text: Text data separated by spaces or tabs
Data Preparation Tips
- Make sure the first row is a header (column names), like "Month", "Revenue", "Cost"
- Keep each column's format consistent (don't mix dates and text)
- If you have too much data (over 100 rows), send the first 20 rows first so AI understands the structure, then send the complete data
- If you have multiple tables, analyze one first, then add others
Step 2: Tell AI What You Want to Analyze
With your data ready, the next step is telling AI your needs. The key is to clearly state three things: what data you have, what you want to learn, and how you want it presented.
Universal Prompt Templates
Basic Analysis Template:
Here is my [XXX] data. Please analyze [specific need]. Display the results using [chart type] and provide your interpretation and suggestions.
Advanced Analysis Template:
Please analyze the following data, finding: 1) overall trends; 2) anomalies; 3) comparative rankings; 4) your improvement suggestions. Present using a combination of charts and text.
What if You're Not Sure What to Ask?
If you're not sure what to analyze, just say:
"Here is my sales data. I'm not sure what angles to analyze. Please find valuable insights and present them with charts."
AI will automatically discover perspectives you hadn't thought of.

Scenario 1: Sales Data Analysis
This is the most common analysis need. Suppose you have this data:
| Month | Revenue ($K) | Cost ($K) | Profit ($K) |
|---|---|---|---|
| Jan | 52 | 31 | 21 |
| Feb | 48 | 29.5 | 18.5 |
| Mar | 61 | 35 | 26 |
| Apr | 55 | 33 | 22 |
| May | 70 | 40 | 30 |
| Jun | 65 | 38 | 27 |
How to Ask AI:
For trends: "Please analyze the sales trend in this data, show monthly revenue changes with a line chart, and mark the highest and lowest points."
For profit: "Calculate the monthly profit margin (profit/revenue), find the months with highest and lowest margins, and analyze the reasons."
For comparison: "Use a bar chart to compare monthly revenue and cost, and identify which months had the best cost control."
What AI Will Tell You:
- March and May are sales peaks — likely due to seasonal factors or promotions
- February is the annual low — possibly affected by holiday season
- Profit margin hovers around 40%, with May being the highest (42.9%), indicating the best cost control
- Suggestion: Increase marketing investment in March and May; reduce inventory in February
Scenario 2: User Behavior Analysis
If you have website traffic or app usage data, AI can help analyze user behavior.
Sample Data:
| Channel | Visits | Signups | Payments |
|---|---|---|---|
| Search Engine | 12,000 | 480 | 96 |
| Social Media | 8,500 | 255 | 38 |
| Direct Traffic | 5,000 | 300 | 120 |
| Paid Ads | 15,000 | 600 | 72 |
How to Ask:
"Please analyze the conversion rates for each channel (visit to signup to payment), present with comparison charts, find the highest and lowest converting channels, and provide optimization suggestions."
AI Analysis Results:
- Direct traffic has the highest signup conversion rate (6%) and payment conversion rate (2.4%) — returning users and brand-aware users are most valuable
- Paid ads drive the most traffic but have the lowest payment conversion rate (0.48%) — high spending, poor results
- Search engines have balanced metrics across the board — the most cost-effective channel
- Suggestion: Optimize ad strategy, reduce inefficient ad budgets; strengthen brand building to increase direct traffic
Scenario 3: Survey Data Analysis
Conducted a survey but don't know how to process hundreds of responses? AI analyzes them instantly.
How to Ask:
"Here are our product satisfaction survey results (1-5 scale). Please analyze: 1) average score for each dimension; 2) the lowest-scoring dimension; 3) a bar chart comparing all dimensions; 4) improvement suggestions."
What AI Will Do:
- Calculate average scores for each dimension (features, speed, UI, support, pricing)
- Create a bar chart visually comparing all dimensions
- Identify the lowest-scoring dimension and analyze possible causes
- Provide specific improvement suggestions and priority rankings
Scenario 4: Personal Budget Analysis
Want to see where your money is going? Send your expense data to AI.
How to Ask:
"Here are my expenses from last month. Please: 1) summarize spending by category; 2) show each category's proportion with a pie chart; 3) identify areas where I can save; 4) suggest a budget for next month."
AI Will Tell You:
- Dining accounts for 35%, the largest expense — cooking at home could save 40%
- Transportation accounts for 15% — consider biking for short distances
- You have duplicate subscriptions (two music platforms) — cancel one
- Entertainment spending is reasonable, no cuts needed
Chart Selection Guide
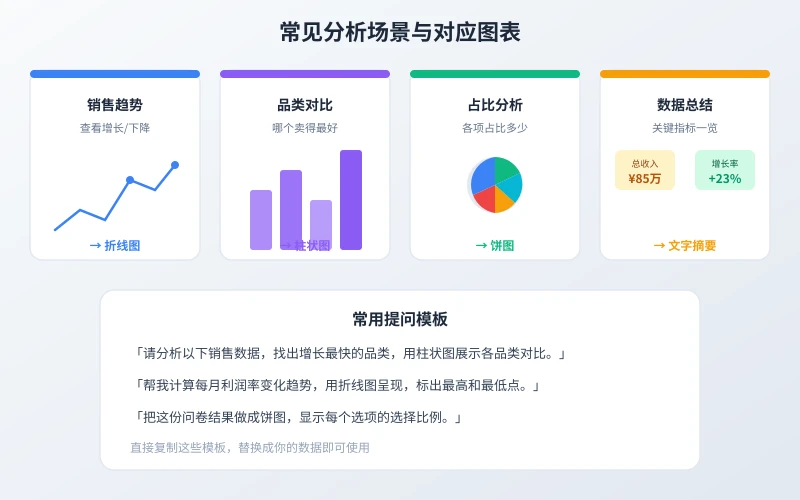
Not sure which chart to ask AI for? Choose based on your analysis goal:
| Analysis Goal | Recommended Chart | Use Case |
|---|---|---|
| Track trends | Line Chart | Monthly revenue, user growth |
| Compare sizes | Bar Chart | Category sales, channel comparison |
| Show proportions | Pie Chart | Spending categories, user sources |
| Key metrics | Number Cards | Total revenue, growth rate, conversion |
| Variable relationship | Scatter Plot | Ad spend vs. revenue |
Not sure which to use? Just tell AI "use the most appropriate chart" and it will choose automatically.
Universal Prompt Templates
Copy these templates directly, replace with your data, and start using:
Template 1 - Trend Analysis:
Please analyze the time trends in this data, show changes with a line chart, mark key turning points, and explain possible reasons.
Template 2 - Comparison Analysis:
Please compare the following data items, show rankings with a bar chart, identify the best and worst performers, and analyze the gap.
Template 3 - Comprehensive Analysis:
Please perform a comprehensive analysis: 1) overall trends; 2) item comparisons; 3) anomaly detection; 4) your recommendations. Present with charts and text combined.
Template 4 - Forecast and Suggestions:
Based on the historical data below, please predict the trend for next month/quarter, provide predicted values with confidence intervals, and explain your reasoning.
Practical Tips
What if the Data is Too Large?
- Send the first 20 rows so AI understands the data structure
- Then say "The above shows the data structure. The full dataset has 500 rows, which I'll send in batches"
- After sending all batches, say "All data has been sent, please begin analysis"
Not Satisfied with the Results?
- "Please use a different chart type"
- "Please analyze item XX in more detail"
- "Please add year-over-year / month-over-month analysis"
- "Please explain this data in simpler language"
How to Export Analysis Results?
- AI-generated text analysis: copy directly to Word or email
- AI-generated charts: if it provides HTML/SVG code, save as .html file and open in a browser to see the chart
- AI suggestions: organize into a to-do list and implement one by one
A Recommended API Platform
If you want to integrate AI data analysis into your own system (like automated weekly reports or real-time data monitoring), you can use the Ciyuano platform. One API Key gives you access to DeepSeek, ChatGPT, Claude, and more:
- Visit Model List to see all available models
- Create a key on the API Key Management page
- Set the API address to
https://www.ciyuano.com/v1, enter your Key, and you're ready
Summary
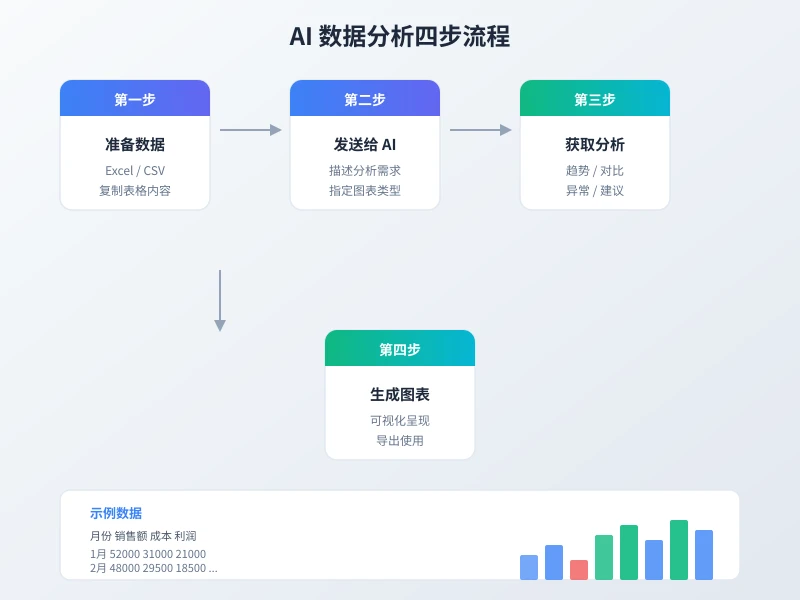
Data analysis isn't just for professionals. With AI, anyone can discover valuable insights from data. Remember this workflow:
- Prepare data: Format as a table, copy and paste to AI
- State your needs: Tell AI what to analyze and which charts to use
- Get results: AI provides analysis, charts, and suggestions
- Follow up: Dig deeper into interesting points
Next time you're staring at a pile of data with no idea what to do, don't struggle with Excel alone — just send it to AI and get a professional analysis report in 3 minutes.
Related Articles
AI 帮你写简历:从零到专业,五步搞定求职利器
不管你是应届生还是职场转行,AI 都能帮你把简历从"凑合能用"变成"眼前一亮"。本文用五个步骤,手把手教你用 AI 生成、修改、优化出一份真正能拿面试的专业简历。
AI 语音转文字:零基础实操指南,三步把说话变成文字
还在打字到手指发酸?还在为会议记录发愁?AI 语音转文字技术已经非常成熟,学会使用它,可以帮你把说话直接变成文字,效率提升数倍。本文将手把手教你选择工具、完成转写、导出使用,让 AI 成为你的打字替身。
Tech FrontierAI 提问技巧入门:让 AI 回答更准确的 7 个实用方法
明明 AI 功能强大,但每次提问得到的回答都差强人意?其实问题往往不在 AI,而在于你提问的方式。本文用最直观的方式教你 7 个让 AI 回答更准确的实用技巧,包括四要素公式、精准提问、背景信息、拆分任务、追问迭代、万能模板和常见错误,小白也能立即上手。
Comments are not yet available, stay tuned