Tech Blog
AI model integration guides, API tutorials, tech sharing and product updates

AI Data Analysis & Visualization: Understand Your Data Without Writing Code
Staring at a pile of Excel data with no idea where to start? This article teaches you how to use AI for data analysis — from data cleaning and trend discovery to chart generation. Four real-world scenarios with step-by-step guides, no programming skills needed, just copy and paste.
AI Data Analysis Guide: From Excel to Smart Reports
Learn to use AI for data analysis from scratch. Covers data preparation, prompt templates, chart generation, and result verification. A complete beginner tutorial.
AI-Powered Data Analysis: A Smart Upgrade Guide for Excel Users
Still writing formulas for data analysis? This guide shows how to use AI tools for Excel data analysis — from cleaning to trend forecasting, all with natural language, no function knowledge required.
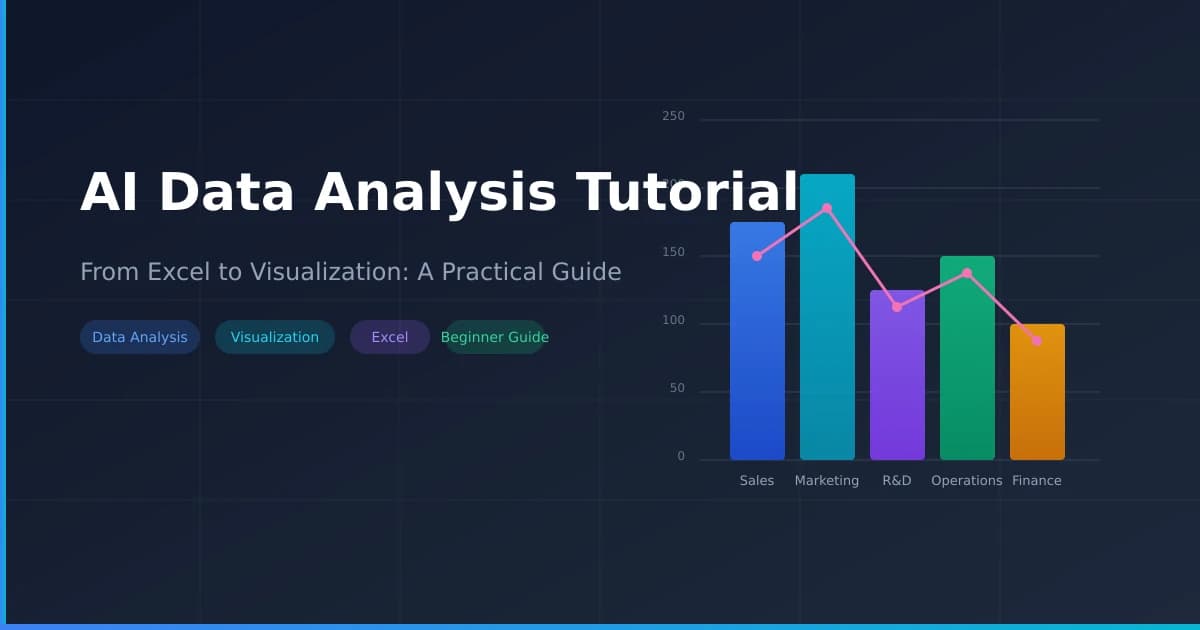
AI Data Analysis Tutorial: From Excel to Visualization
Learn to do data analysis with AI from scratch. Upload Excel files, filter with natural language, generate charts, and create reports — 5 hands-on scenarios for beginners.
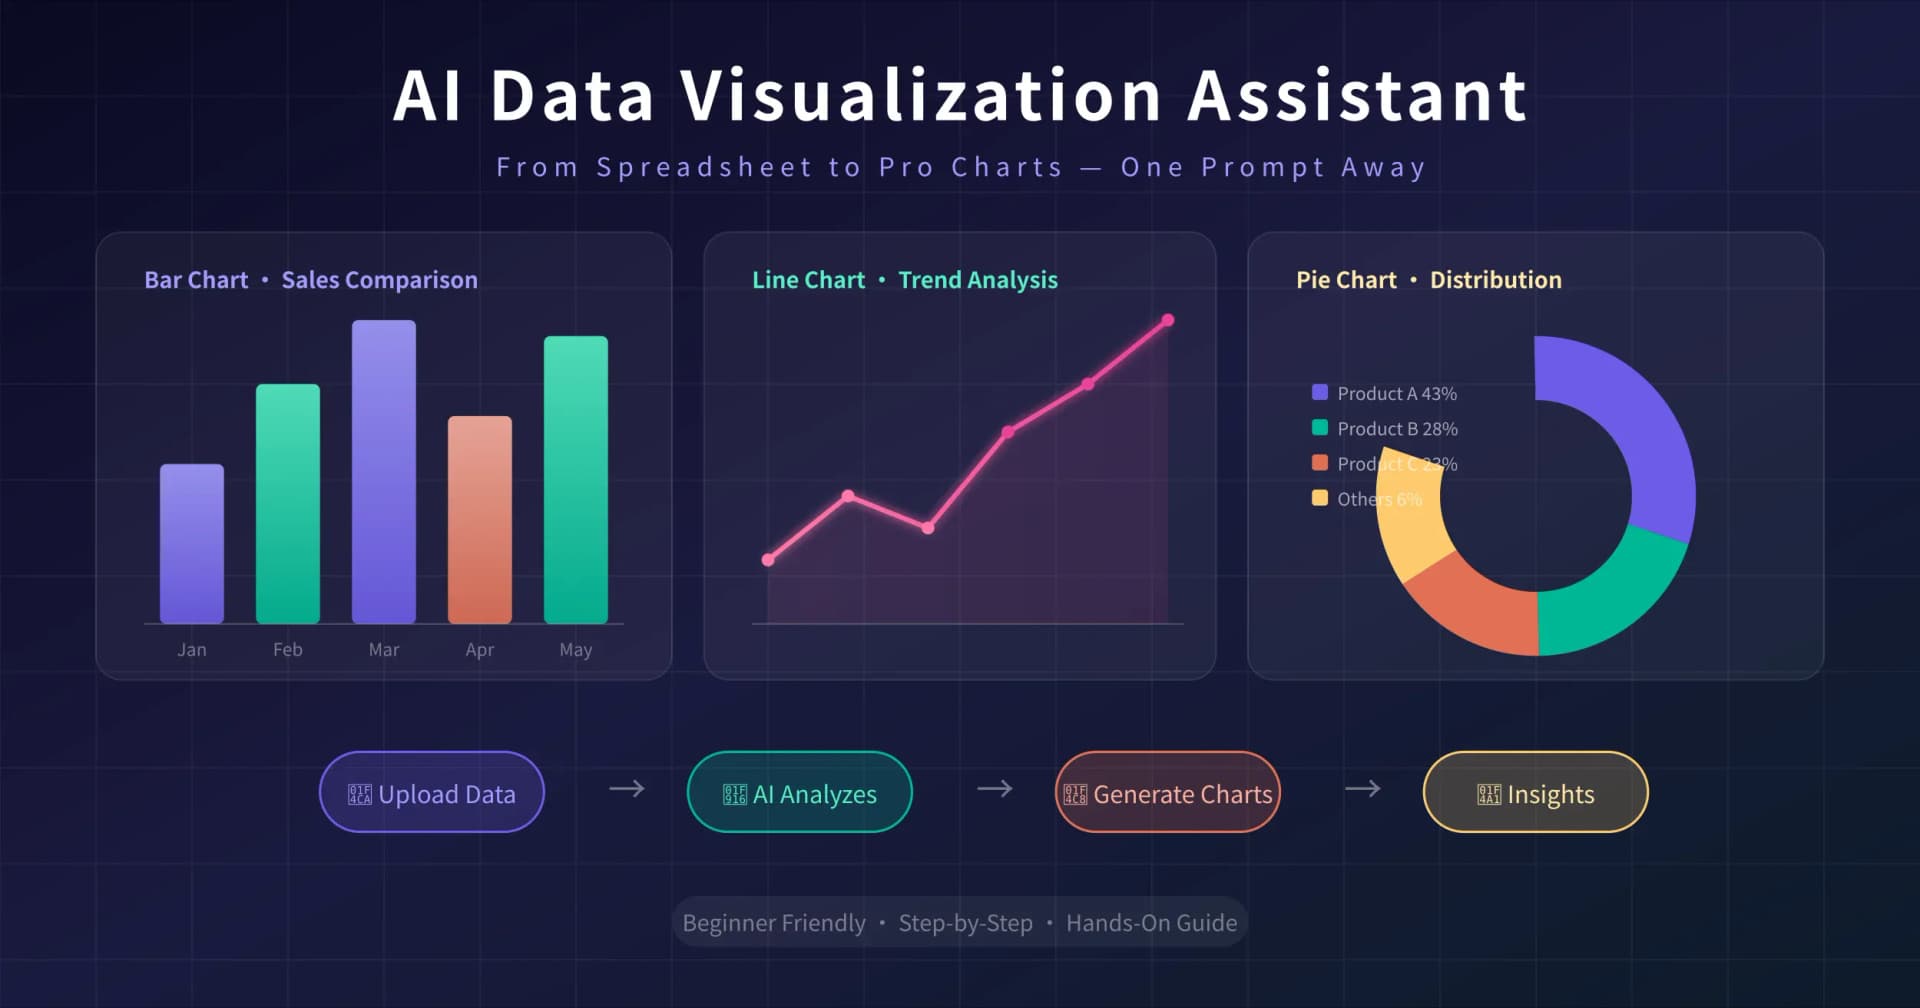
AI Data Visualization Assistant Practical Guide: From Tables to Charts, Generate Professional Visualizations with One Sentence
Facing a pile of Excel data and want to create charts but don’t know how to use professional tools? This article teaches you to use AI to instantly turn table data into bar charts, line charts, and pie charts, while also automatically analyzing trends and generating data insights. Even beginners can produce professional-level visualizations—read it and you’ll be ready to use it.
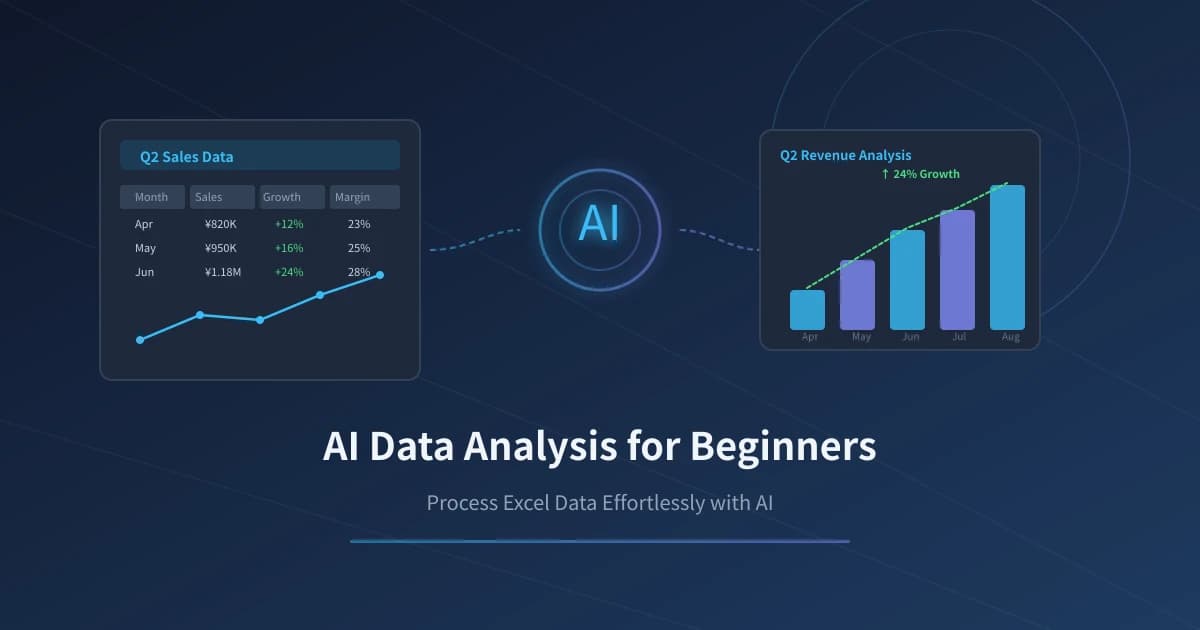
AI Data Analysis for Beginners: Easily Process Excel Data with AI
Easily analyze Excel data with AI: upload a table, ask questions in natural language, and generate charts and reports. Three steps to complete data analysis without needing formulas or programming skills.

AI Data Analysis Assistant: Quickly Process Excel, CSV, and Data Reports with AI
Learn to use AI for data analysis from scratch: data cleaning, query statistics, trend analysis, visual charts, and automated report generation—5 practical scenarios with step-by-step guidance.