AI-Powered Data Analysis: A Smart Upgrade Guide for Excel Users
Ever found yourself staring at an Excel spreadsheet with thousands of rows of sales data, while your boss asks you to "analyze the trends"? You open Excel, stare at blank cells, trying to remember VLOOKUP, SUMIF, pivot tables... and spend two hours producing a chart that still doesn't look right. What if there was a tool where you simply say "help me see which products sold best this half year" and it automatically organizes the data, generates charts, and delivers analysis — that's the power of AI-powered data analysis.
What Can AI Data Analysis Do?
Many people think AI data analysis is limited to "calculating averages." In reality, it can do far more:
- Data Cleaning: Automatically identifies duplicates, missing values, and format inconsistencies, producing a clean dataset
- Trend Analysis: Discovers growth, decline, and seasonal patterns from time-series data
- Comparative Analysis: Automatically splits data by dimensions to compare performance across products, regions, and time periods
- Anomaly Detection: Quickly spots outliers and anomalies in your data
- Visualization: Recommends the best chart type based on your data and generates it automatically
- Prediction & Insights: Provides future trend forecasts and actionable recommendations based on historical data
Simply put, AI data analysis is like hiring a data analyst who never rests, never miscalculates, and explains results in plain language you can understand.
Before You Start: What You Need
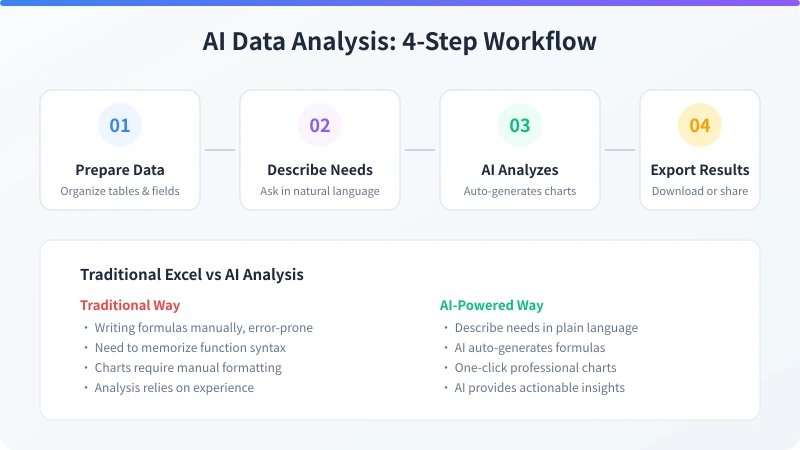
Before handing your data to AI, you need to do two things:
1. Make Sure Your Data is "Clean"
No matter how smart AI is, it can't analyze messy data. "Clean" means:
- Every column has a clear header: Use labels like "Date," "Product Name," "Revenue" — not "Column 1," "Column 2"
- Consistent data formats: Date columns should all be date format, number columns shouldn't contain text
- No merged cells: Merged cells are the enemy of data analysis — ensure each cell holds only one value
- No extra blank rows or columns: Your data range should be compact and continuous
2. Know What You Want to Analyze
This step is crucial. Many people start analyzing right after getting data, produce a bunch of charts, and hear "that's not what I asked for." Before starting, ask yourself three questions:
- What's the goal? Finding growth opportunities, identifying problems, or making predictions?
- What information does the data contain? Time, products, regions, amounts, quantities?
- Who's the audience? Executives need concise summaries; technical teams need detailed precision
In Practice: Three Common Analysis Scenarios
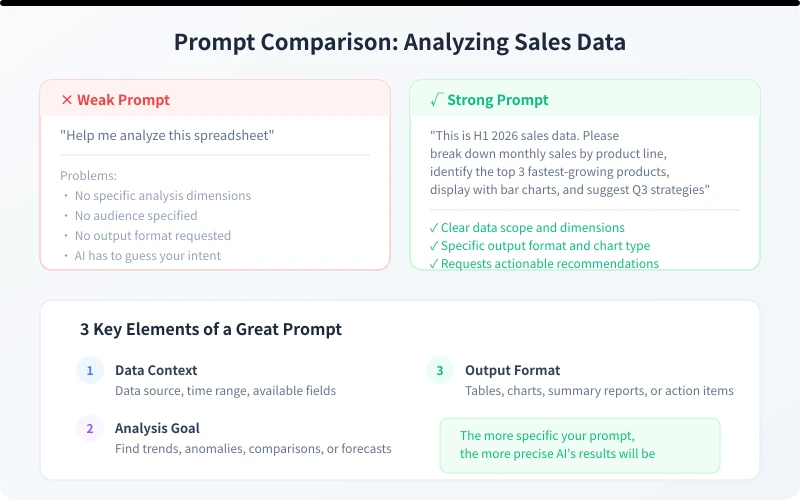
Scenario 1: Sales Trend Analysis
This is the most common need. You have several months of sales data and want to understand overall trends and product performance.
Steps:
Step 1: Open your AI tool and upload your Excel file or paste the data.
Step 2: Describe your needs in natural language. For example:
This is Jan–Jun 2026 sales data with four fields: date, product name, revenue, and quantity.
Please help me:
1. Calculate monthly total revenue and display the trend with a line chart
2. Compare half-year total revenue by product using a bar chart
3. Find the fastest-growing and biggest-declining product
4. Provide sales recommendations for the second half of the year
Step 3: AI will automatically complete data aggregation, generate charts, and deliver analysis conclusions — usually in under a minute.
Pro tip: If the chart colors don't match your needs, specify "use blue color scheme" or "colors suitable for printing" in your prompt. For multi-dimensional cross-analysis, say "cross-analyze by region and product."
Scenario 2: Data Cleaning & Organization
Often, the data you receive isn't "clean" — with duplicate rows, missing values, and format inconsistencies. Previously you'd write formulas or use pivot tables manually. Now AI can handle it.
Steps:
Step 1: Upload your problematic data file to AI.
Step 2: Describe the data issues. For example:
This customer data has the following issues:
1. Duplicate customer records (same customer appears multiple times)
2. Some customer phone numbers are missing
3. Registration dates have inconsistent formats (some YYYY-MM-DD, some MM/DD/YYYY)
4. City field has variations like "Beijing" vs "Beijing City"
Please clean the data, output a clean table, and tell me how many records were processed.
Step 3: AI will provide a cleaning plan and results. It not only processes the data but also explains the logic, making it easy to verify.
Scenario 3: Comparative Analysis & Root Cause
Managers often ask: "Why did performance drop last month?" Previously you'd spend half a day splitting data and building comparison tables. With AI, you can get answers quickly.
Steps:
Step 1: Upload data from both months.
Step 2: Describe the comparison. For example:
I've uploaded two datasets: June and July sales details.
Please compare the differences:
1. What's the overall revenue change?
2. Which products contributed to growth? Which dragged performance?
3. By region, which areas had the biggest changes?
4. Provide 3 actionable improvement suggestions
AI will automatically perform cross-comparative analysis, identify key variables, and deliver data-backed recommendations. This type of analysis used to take a data analyst half a day — now it takes just minutes.
Five Practical Tips
Master these tips to double your data analysis efficiency:
Tip 1: Let the Data Introduce Itself First
Before analyzing, ask AI to understand the data basics. Say: "Please first review this data: how many rows, what type each column is, and whether there are missing values." This helps AI better understand your data, leading to more accurate analysis.
Tip 2: Ask Step by Step, Not All at Once
Many people try to cram all analysis needs into one prompt, resulting in long, messy output. A better approach: start with data cleaning, then trend analysis, then root cause analysis. Confirm each step's results before moving on.
Tip 3: Ask AI to Explain Its Logic
After getting results, ask "How did you reach this conclusion? What calculation method did you use?" This helps verify the analysis is reasonable and teaches you analytical thinking.
Tip 4: Save Your Winning Prompt Templates
Save prompts you've validated in real work as your personal "analysis template library." Next time you face similar needs, just apply the template — much faster.
Tip 5: AI Analysis + Human Judgment = Best Combination
AI excels at processing large datasets, finding patterns, and generating charts. But business judgment, strategic decisions, and interpersonal communication still need humans. Treat AI as your "analysis assistant" rather than "decision maker" for the best results.
Common Questions
How is AI analysis different from Excel pivot tables?
Pivot tables require you to manually select rows, columns, values, and filters — demanding high operational skill. AI data analysis lets you describe needs in natural language, and AI automatically handles splitting, aggregation, and visualization. For simple summaries the difference is minimal; for complex multi-dimensional analysis and trend forecasting, AI's efficiency advantage is significant.
What if my dataset is very large?
Different AI tools handle different data volumes. Most tools handle datasets under tens of thousands of rows. For larger datasets, filter the relevant portion in Excel first, then hand it to AI. Professional data analysis AI tools like DeepSeek and Claude support larger datasets.
Are the analysis results accurate?
Accuracy depends on two factors: data quality and prompt quality. With clean data and clear questions, AI results are usually very accurate. However, AI can make mistakes — like using the wrong base when calculating growth rates. For important decisions, ask AI to explain its calculation logic, or manually verify key numbers in Excel.
Will my business data be leaked?
This is an important question. When using public AI platforms, anonymize data before uploading — replace customer names with codes, convert specific amounts to ratios. For sensitive data, consider AI tools that support private deployment, where data never leaves your server.
Can I use this without knowing any Excel formulas?
Absolutely. This is AI data analysis's biggest advantage — you don't need to remember any function syntax, no VLOOKUP, IF, SUMIFS. Just describe what you want to analyze in plain language, and AI handles the rest. The only skill you need is "describing your requirements clearly."
📖 Related Articles
AI Home Budget Tracking: From Confused Bills to Clear Budgets
Every month after paying rent and credit card bills, where did the rest of the money go? AI can help you track every transaction clearly. This tutorial teaches you how to use AI tools for home budget tracking, from scanning receipts to creating monthly budgets, all with zero technical skills.
AI-Powered PPT Presentations: Complete Guide from Outline to Final
Creating presentations is no longer a pain. This step-by-step guide teaches you how to make professional presentations with AI from scratch — define topic, generate outline, fill content, polish and export. Includes ready-to-use prompt templates and common mistakes to avoid.
AI-Powered Podcast Creation: Complete Guide from Script to Publish
Podcasts are becoming an increasingly popular way for people to consume information and share ideas. But producing a quality podcast requires topic selection, scriptwriting, recording, editing, and pu
💬 Comments are not yet available, stay tuned