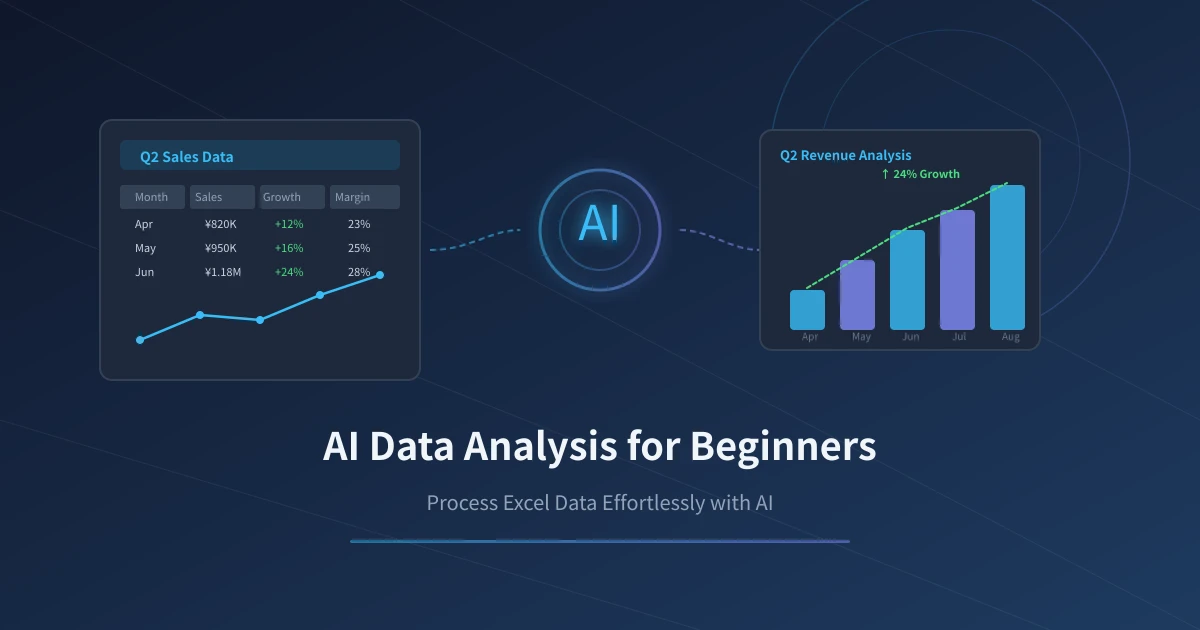
AI Data Analysis for Beginners: Easily Process Excel Data with AI
Why Use AI for Data Analysis?
Many people feel overwhelmed when faced with a pile of Excel data: they don't know how to write formulas, can't figure out pivot tables, and have no idea how to create charts. In reality, you don't need to learn any advanced Excel features. As long as you can type and ask questions, AI can handle everything from data cleaning to visual reports.
This article will teach you how to analyze Excel data from scratch using AI in 3 core steps. No data analysis background required—just the ability to describe your needs in natural language.
Preparation
You need an AI chat tool that supports file uploads. The following options all work well:
- ChatGPT (OpenAI): Supports direct Excel file uploads, strongest data analysis capabilities
- Claude (Anthropic): Excels at interpreting complex data relationships and produces more detailed analysis reports
- Tongyi Qianwen / Wenxin Yiyan: Good Chinese language understanding, suitable for Chinese headers and business terminology
- Ciyuano Platform: Aggregates multiple models, allowing you to compare different analysis results
Using the web version is recommended for easier file uploads. Have your Excel file ready and you can start.
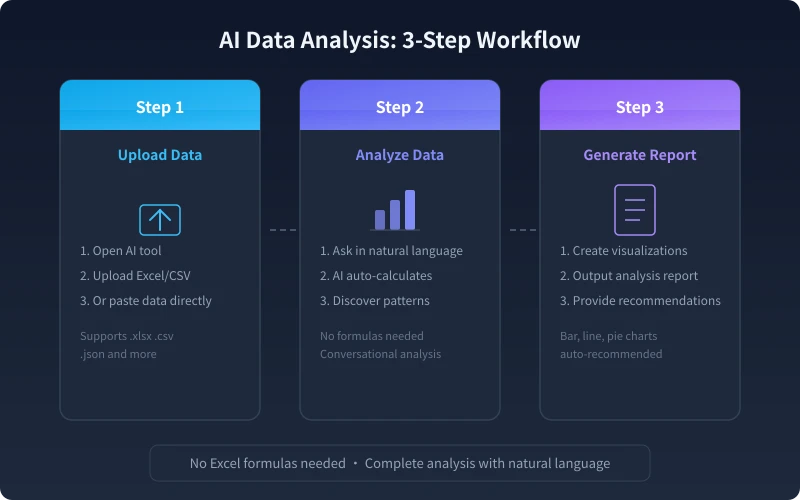
Step 1: Give Your Data to AI
The premise for AI to analyze data is that it can see your data. The key in this step is to correctly hand over the data to AI.
Steps
- Open your chosen AI tool (ChatGPT or Claude recommended)
- Find the "Upload File" or "Attachment" button in the dialogue box
- Select your Excel file (.xlsx) or CSV file (.csv) and upload it directly
- After uploading, AI will automatically recognize the file content and display a data preview
Notes on Uploading Data
- File Size: Most AI tools support files under 10MB; if larger, first filter the key data
- Clear Headers: Ensure the first row contains column titles like "Date", "Sales", "Region", and avoid merged cells
- Data Format: Keep date columns uniform, avoid mixing text in numeric columns, and use blank cells instead of "None" for empty values
- Sensitive Information: Check for personal data like ID numbers or phone numbers before uploading; anonymize if necessary
What If the File Is Too Large?
If the Excel file exceeds the upload limit, you can:
- Copy only the sheets or ranges you need to analyze
- Paste them into a new Excel file and upload that
- Or paste the table data directly into the dialogue box (suitable for small datasets)
Step 2: Ask Questions in Natural Language for Analysis
Once the data is uploaded, you don't need to write any formulas or code. Simply tell AI in everyday language what you want to know, and it will automatically calculate and analyze.
Steps
- Start with a data overview: Send "Please summarize the overall situation of this data"
- Ask specific questions: For example, "Which month had the highest sales? What is the growth trend?"
- Dig deeper: For instance, "In the month with the highest sales, which product contributed the most?"
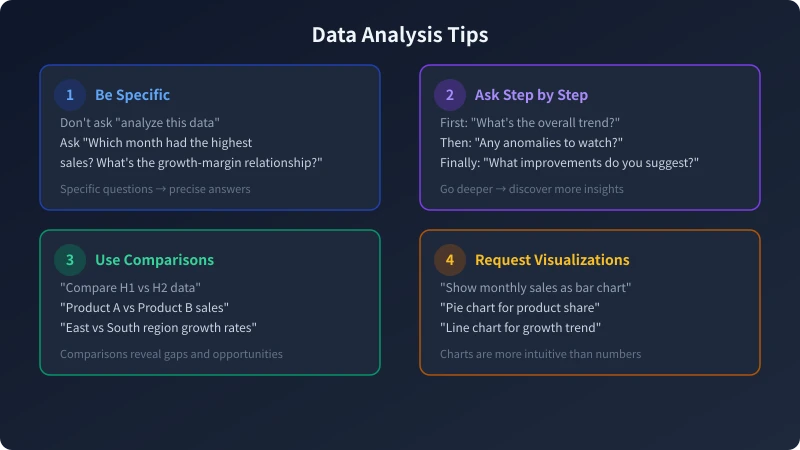
- Request comparative analysis: For example, "Compare the data from the first half and the second half of the year. What changes are there?"
Universal Question Templates
Here are some templates you can copy and use directly:
- Data Overview: Please summarize the main features of this data, including data volume, time range, mean and extreme values of key indicators.
- Trend Analysis: Please analyze the trend of [column] over time. Are there any cyclical patterns?
- Anomaly Detection: Please check the data for any outliers or anomalies and explain the reasons.
- Correlation Analysis: Please analyze whether there is a relationship between [column A] and [column B] and the strength of that relationship.
- Ranking Statistics: Please rank the data by [column] and list the top 10.
Advanced Questioning Techniques
- Provide Business Context: For example, "I am an operations manager at an e-commerce company, and this data is sales data for the last 6 months." AI will tailor analysis based on industry knowledge.
- Specify Analysis Dimensions: For example, "Please analyze from three dimensions: time, region, and product category." This is much more effective than a vague "analyze this."
- Ask for Conclusions: For example, "Please summarize the core finding in one sentence" to avoid verbose, unfocused answers from AI.
Step 3: Generate Visual Charts and Reports
After analysis is complete, have AI turn the results into intuitive charts and structured reports. This step is often overlooked but is the most valuable.
Steps
- Request chart generation: Send "Please use a bar chart to show the monthly sales trend"
- Specify chart type: Bar charts for comparison, line charts for trends, pie charts for proportions
- Request a summary report: Send "Please organize the above analysis into a structured report containing key findings and action recommendations"
- Export results: Have AI compile analysis conclusions into a bullet list for easy copying into work presentations
Common Chart Types and Use Cases
- Bar Chart: Good for comparing data across categories, e.g., sales by region
- Line Chart: Good for showing time series trends, e.g., monthly growth curve
- Pie Chart: Good for showing proportional structures, e.g., revenue share by product line
- Scatter Plot: Good for showing relationships between two variables, e.g., price vs. sales volume
- Heatmap: Good for showing multi-dimensional data distribution, e.g., order density by time and region
How to Get Better Reports from AI
- Specify the audience: Tell AI "this is for the leadership" or "this is for internal team use" — the tone and detail level will differ
- Define report structure: For example, "Please include four sections: Data Overview, Key Findings, Trend Predictions, and Action Recommendations"
- Require data support: For example, "Each conclusion must be accompanied by specific numbers" to avoid vague qualitative descriptions
Common Issues and Solutions
What If AI Doesn't Understand My Data?
Possible causes and solutions:
- Unclear Headers: Change the first row to meaningful column names, e.g., replace "A, B, C" with "Date, Sales, Region"
- Messy Formatting: Clean up data format in Excel first by removing blank rows and merged cells
- Too Much Data: Filter out a key subset of data before uploading
What If AI's Analysis Results Are Inaccurate?
- Ask for Verification: Have AI show its calculation process, e.g., "Please tell me how you calculated this average"
- Cross-Validate: Calculate a key number yourself in Excel and compare it with AI's result
- Rephrase Your Question: Sometimes a different wording can lead AI to a different analytical perspective
Is It Safe If Data Involves Trade Secrets?
- Enterprise versions of mainstream AI tools (ChatGPT, Claude) do not use your data for training
- Free versions may carry risks of data being used for training; consider using enterprise versions or private deployment
- Always anonymize sensitive information before uploading: remove customer names, contract amounts, etc., and replace them with codes
Practical Example: Analyze Sales Data in 3 Minutes
Below is a complete case study demonstrating the entire process:
- Upload: Open ChatGPT and upload an Excel file containing "Date, Product, Region, Sales, Profit"
- Ask: Send "Please analyze this sales data, focusing on: 1) Overall trend; 2) Best-selling products; 3) Regional performance differences"
- Follow up: Send "Which region has the fastest sales growth? How is the profit performance in that region?"
- Chart: Send "Please show product sales in a bar chart and monthly trends in a line chart"
- Report: Send "Please organize the above analysis into a concise report. I need to present it at tomorrow's meeting"
The entire process takes about 3 minutes, and the results include data analysis, visual charts, and a structured report, ready to be used in work presentations.
📖 Related Articles
AI Mobile Photography Assistant Practical Guide: Composition Tips, Scene Optimization, and Post-Processing All in One
Can't take good photos with your phone? This article teaches you how to use AI tools to handle composition, settings, and post-processing. From food to portraits, from daytime to night scenes, four scenarios broken down step by step. Even beginners can capture stunning photos that get likes on social media.
TutorialsAI Sleep Management Assistant: Track Sleep, Improve Routine, and Boost Sleep Quality
Struggling with sleep? This article shows you how to use AI tools to track sleep data, analyze sleep patterns, and create personalized improvement plans. From trouble falling asleep to waking up in the middle of the night, AI helps you find the root cause and continuously optimize—a sleep management guide that even beginners can use.
TutorialsAI Legal Assistant Guide: Contract Review, Rights Protection & Document Drafting Made Easy
Can't understand your lease? Don't know how to handle a workplace dispute? AI can help you review contracts, analyze legal issues, and draft legal documents. This guide covers three practical scenarios to turn AI into your personal legal advisor.
💬 Comments are not yet available, stay tuned